

Not all insights are created equal.
Some come from rigorous, mixed-methods research conducted last month. Others are based on a single survey from two years ago. Both might be useful—but you should probably treat them differently when making decisions.
The Insight Triangulation Score is a simple framework I use to assess how confident we should be in a piece of information. It works whether you’re synthesizing findings within a single project or connecting patterns across your entire organization’s research.
Why This Matters
Here’s the thing: you don’t always need high-quality data to make decisions. Sometimes you’re comfortable with more risk. Sometimes speed matters more than certainty. Sometimes “directionally correct” is good enough.
But you should know where you stand.
Think of it like a weather forecast. A 90% chance of rain and a 40% chance of rain both give you useful information—but you’d pack differently for each. The Insight Data Quality Score helps you understand whether you’re looking at a 90% insight or a 40% one, so you can calibrate your confidence accordingly.
The Four Pillars
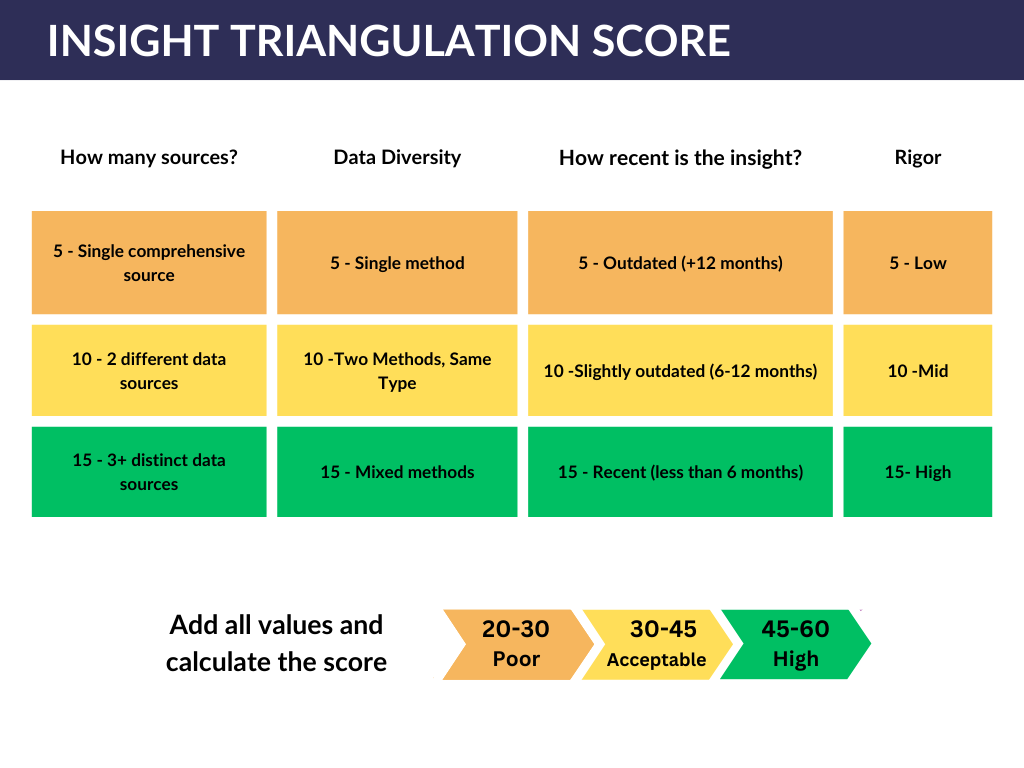
The framework scores insights across four dimensions, each rated Low (5), Medium (10), or High (15):
1. Number of Sources
Question: In how many separate reporting artifacts has this finding appeared?
I say “reporting artifacts” rather than “research reports” deliberately. This could include:
Formal research reports
Customer success team newsletters
Sales debriefs
Product team presentations
Support ticket analyses
The more places something surfaces independently, the more confidence you can have that it’s real—not just an artifact of one particular study or one team’s perspective.
2. Data Diversity (Methods)
Question: What variety of methods produced this finding?
This is about methodological triangulation. A finding that shows up in both qualitative interviews and quantitative surveys carries more weight than one that only appeared in surveys—even if it appeared in multiple surveys.
Think of it like witnesses to an event. Ten people who all watched the same video aren’t as convincing as three people who saw it from different angles.
Would you rather listen to this on the go? Check out the episode on Spotify!
3. Recency
Question: How fresh is this data?
Research has a shelf life. User needs evolve, markets shift, products change. A finding from three years ago might still be valid—or it might be completely outdated.
What if you have mixed timeframes? Say a finding appeared in reports from both last year and last month. Use your judgment—average it out. If most sources are old and only one is recent, lean toward the older score. If it’s evenly split, land in the middle.
4. Rigor
Question: How methodologically sound was the research that produced this?
This is the fuzziest category, and honestly, some people will disagree with how I approach it. But here’s the reality: not all research is conducted with equal rigor.
A well-designed study by an experienced researcher with proper sampling and analysis? High rigor. Informal discovery interviews conducted by a PM between meetings? Lower rigor. Customer support tickets analyzed for themes? Lower still.
This isn’t about gatekeeping or dismissing non-researcher contributions—it’s about being honest that methodology affects reliability.
How to Actually Use This
A few important notes on application:
“Poor” doesn’t mean “useless.” You can absolutely make decisions based on lower-quality insights—you’re just doing so with eyes open about the risk. Some decisions don’t require high confidence. Some timelines don’t allow for more research. That’s fine. The score helps you match your confidence level to the stakes.
Use it to identify gaps. If an important insight scores low, ask: what would raise the score? Maybe you need to validate with a different method. Maybe you need fresher data. The framework shows you exactly which dimension is weak.
Combine it with prioritization frameworks. If you use something like RICE (Reach, Impact, Confidence, Effort), this framework plugs directly into the “C.” Or use it as a first step before assigning business value or assessing implementation complexity.
It’s subjective—and that’s okay. This isn’t an automated system. It requires judgment, especially for recency averaging and rigor assessment. That’s a feature, not a bug. The goal is structured thinking, not false precision.
Make It Yours
As always, I’m sharing the minimum viable version of this framework. It works well in contexts where you’re the first researcher or a solo practitioner—simple tools that go a long way.
If your context calls for more complexity—more score gradations, additional dimensions, weighted categories—add them. This is a starting point, not a final destination.
